


Edition: BP 2025 (Ph. Eur. 11.6 update)
Action and use
Cytokine.
DEFINITION
Interferon Beta-1a Injection is a sterile solution of Interferon Beta-1a Concentrated Solution in a suitable liquid. It is supplied as a ready-to-use solution.
PRODUCTION
Glycoforms
Interferon beta-1a Injection is manufactured and tested using methods which produce a product containing not less than 50% of the main active di-sialylated form. The method of analysis used should be capable of resolving, identifying and quantifying all of the main glycoforms present, with specific limits for each form being set by the competent regulatory authority.
Acidity
The pH of the injection is controlled, Appendix V L, so as to ensure the stability and quality of the product throughout its shelf-life. The limits are approved by the competent authority. The injection complies with the requirements stated under Parenteral Preparations and with the following requirements.
Content of interferon beta-1a, C908H1406N246O252S7
For products containing 8.8 μg or less of interferon beta-1a
80.0 to 120.0% of the stated amount.
For products containing more than 8.8 μg of interferon beta-1a
90.0 to 110.0% of the stated amount.
Potency
The estimated potency is not less than 80% and not more than 125% of the stated potency.
CHARACTERISTICS
Clear or slightly opalescent, colourless or slightly yellowish liquid.
IDENTIFICATION
A. It gives the appropriate response when examined using the conditions under the Assay for potency.
B. Isoform distribution. Carry out the method for mass spectrometry, Appendix II G. Introduction of the sample Direct inflow of a desalted preparation to be examined or liquid chromatography-mass spectrometry combination.
Mode of ionisation Electrospray Positive.
Signal acquisition Complete spectrum mode from m/z 1100 to 2400.
Calibration Use myoglobin in the m/z range of 600-2400; set the instrument within validated instrumental settings and analyse the sample; the deviation of the measured mass does not exceed 0.02 per cent of the reported mass.
Interpretation of results A typical deconvoluted spectrum consists of 6 major glycoforms (A to F), which differ in their degree of sialylation and/or antennarity type as shown in the table below.
| MS Peak | Glycoform(1) | Expected Mr | Sialylation level |
| A
B C
D E
F |
2A2S1F
2A1S1F 3A2S1F and/or 2A2S1F + 1 HexNacHex repeat 3A3S1F 4A3S1F and/or 3A3S1F + 1 HexNacHex repeat 2A0S1F |
22,375
22,084 22,739
23,031 23,400
21,793 |
Disialylated
Monosialylated Disialylated
Trisialylated Trisialylated
Non-sialylated |
{1}2A = biantennary complex type oligosaccharide; 3A = triantennary complex type oligosaccharide; 4A = tetraantennary complex type oligosaccharide; 0S = non-sialylated; 1S = monosialylated; 2S = disialylated; 3S = trisialylated; 1F = fucosylated.
Results The deconvoluted mass spectrum obtained with the preparation to be examined corresponds, with respect to the
6 major peaks, to the mass spectrum obtained with interferon beta-1a EPCRS.
C. Carry out the method for peptide mapping, Appendix III K, and liquid chromatography, Appendix III D, using the
following solutions.
(1) If necessary, concentrate the injection by an appropriate procedure, such as membrane ultrafiltration, to a suitable concentration. Add 5 μL of a 24.2% w/v solution of tris(hydroxymethyl)methylamine and a volume of the concentrated injection containing 20 μg of protein to a polypropylene tube of 0.5-mL capacity. Add 4 μL of a 0.1% w/v solution of endoprotease LysC in 0.05M tris-hydrochloride buffer solution pH 9.0. Mix gently and incubate at 30° for 2 h. Add 10 μL of a 1.54% w/v solution of dithiothreitol. Dilute the solution with the same volume of a 57.3% w/v solution of guanidine hydrochloride. Incubate at 4° for 3 to 4 hours.
(2) Prepare at the same time and in the same manner as for solution (1) but using interferon beta-1a EPCRS instead of the injection being examined.
(3) 2.0 w/v % ofInterferon beta-1a oxidised peptide BPCRS in water (for use in the Oxidised forms test).
CHROMATOGRAPHIC CONDITIONS
(a) Use a stainless steel column (25 cm × 2.1 mm) and a stainless steel pre-column (2 cm × 2.1 mm) both packed with spherical octadecylsilyl silica gel for chromatography (5 μm) with a pore size of 30 nm (Vydac 218TP52 is suitable).
(b) Use gradient elution and the mobile phase described below.
(c) Use a flow rate of 0.2 mL per minute.
(d) Use an ambient column temperature.
(e) Use a detection wavelength of 214 nm.
(f) Inject a volume of each of solution (1) and (2) containing 20 μg of digested protein. For use in the test for Oxidised forms, inject 70 μl of solution (3).
MOBILE PHASE
Mobile phase A 0.1% v/v of trifluoroacetic acid
Mobile phase B Mix 1 volume of trifluoroacetic acid with 700 volumes of acetonitrile R1 and dilute to 1000 volumes with water
| Time (Minutes) | Mobile phase A (% v/v) | Mobile phase B (% v/v) | Comment |
| 0-30
30-45 45-50 50-70 70-83 83-85 85-100 |
100→64
64→55 55→40 40→0 0 0→100 100 |
0→36
36→45 45→60 60→100 100 100→0 0 |
linear gradient
linear gradient linear gradient linear gradient isocratic linear gradient re-equilibration |
SYSTEM SUITABILITY
The test is not valid unless the chromatogram obtained with solution (2) is qualitatively similar to the chromatogram of interferon beta-1a digest supplied with interferon beta-1a EPCRS.
CONFIRMATION
The profile of the chromatogram obtained with solution (1) resembles that of the chromatogram obtained with solution (2).
TESTS
Impurities of molecular masses differing from that of interferon beta-1a
Carry out the method for polyacrylamide gel electrophoresis, Appendix III F, under reducing conditions, using 12% acrylamide as the resolving gel.
The concentrated sample buffer consists of concentrated SDS-PAGE sample buffer for reducing conditions containing 2- mercaptoethanol as the reducing agent. The sample buffer consists of equal volumes of concentrated SDS-PAGE sample buffer for reducing conditions and water.
For solution (1) concentrate the injection using a suitable method to obtain a protein concentration of 0.15% w/v. For solution (2) mix equal volumes of solution (1) and the concentrated sample buffer. For solution (3) dilute solution (1) to obtain a protein concentration of 0.06% w/v and mix equal volumes of this solution and the concentrated sample buffer. For solution (4) mix 8 μL of solution (3) and 40 μL of the sample buffer. For solution (5) mix 15 μL of solution (4) and 35 μL of the sample buffer. For solution (6) mix 18 μL of solution (5) and 18 μL of the sample buffer. For solution (7) mix 12 μL of solution (6) and 12 μL of the sample buffer. Solution (8) is a solution of relative molecular weight markers suitable for calibrating SDS-PAGE gels in the range of 15 to 67 kDa dissolved in the sample buffer.
Boil solutions (2) to (8) for 3 minutes and apply 20 μL of each solution to the gel. Perform the electrophoresis under the conditions recommended by the manufacturer of the equipment. Proteins in the gel are visualised by Coomassie staining, carried out as follows: immerse the gel in Coomassie staining solution R1 at 33° to 37° for 90 minutes with gentle shaking, then remove the staining solution; destain the gel with a large excess of a mixture of 1 volume of glacial acetic acid, 1 volume of propan-2-ol and 8 volumes of water.
The apparent molecular weights of: interferon beta-1a, about 23 000; underglycosylated interferon beta-1a, about 21 000; deglycosylated interferon beta-1a, about 20 000; interferon beta-1a dimer, about 46 000. Use the electrophoretogram provided with interferon beta-1a EPCRS to identify the bands.
SYSTEM SUITABILITY
The test is not valid unless:
the validation criteria in Appendix III F are met;
a band is seen in the electrophoretogram obtained with solution (7);
a gradation of intensity of staining is seen in the electrophoretograms obtained with solutions (2) to (7).
LIMITS
The electrophoretogram obtained with solution (3) may show, in addition to the principal band, less intense bands with molecular weights lower than the principal band. The band corresponding to underglycosylated interferon beta-1a is not more intense than the principal band in the electrophoretogram obtained with solution (5) (5 per cent).
The electrophoretogram obtained with solution (2) may show, in addition to the principal band, less intense bands with molecular weights lower than the principal band. The band corresponding to deglycosylated interferon beta-1a is not more intense than the principal band in the electrophoretogram obtained with solution (5) (2 per cent); any other band corresponding to an impurity of a molecular weight lower than that of interferon beta-1a, apart from the band corresponding to underglycosylated interferon beta-1a is not more intense than the principal band in the electrophoretogram obtained with solution (6) (1 per cent).
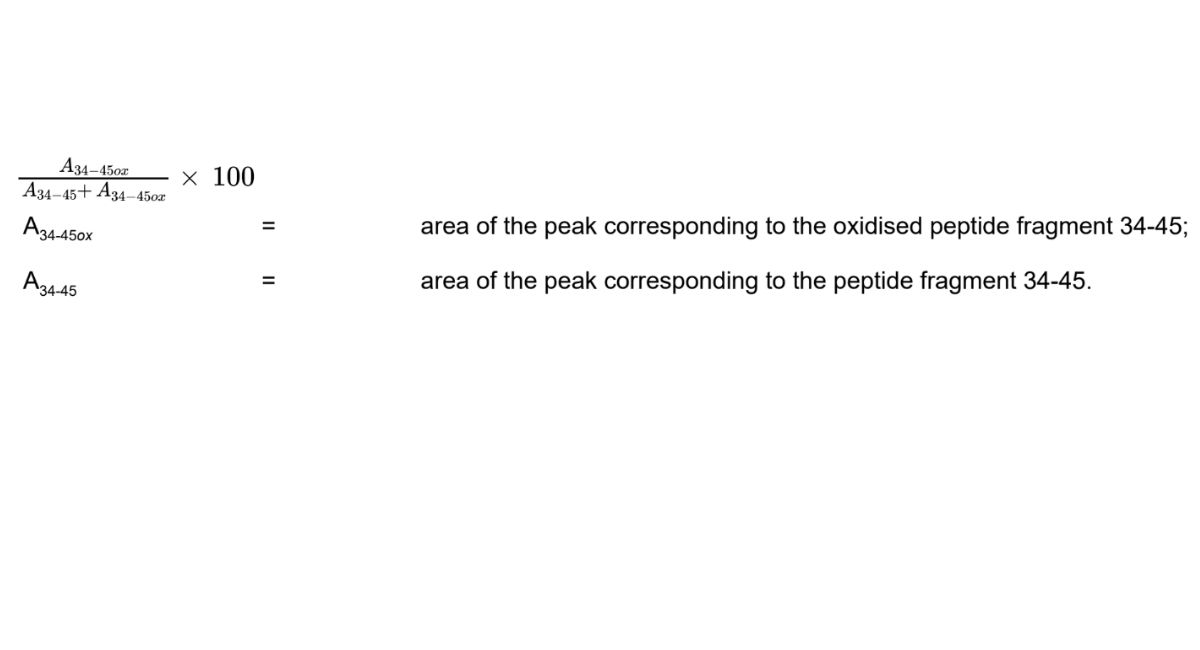
Oxidised forms
Maximum 9.0% of fragment 34-45.
Use the chromatogram obtained with solution (1) in identification C. Locate the peaks due to the peptide fragment comprising amino acids 34 to 45 and its oxidised form using the chromatogram obtained with solution (3) in identification C.
Calculate the percentage of oxidation of interferon beta-1a using the following expression:
Dimers and related substances of higher molecular weight
Use method A or method B. The choice of method A or method B should be based on compliance with the system suitability requirements.
A. Carry out the method for size-exclusion chromatography, Appendix III C, using the following solutions. Store the solutions at a temperature of 5°.
(1) Inject a quantity of injection containing approximately 8.8 μg of interferon beta-1a.
(2) Inject a quantity of solution containing approximately 25 μg interferon beta-1 EPCRS that, following a number of freeze-thaw cycles (usually 3) at -20°, has a percentage content of aggregation products (dimers and aggregates) of at least 3%.
(3) Inject 100 μL of a buffer prepared as follows. Transfer 450 mL, of purified water to a 500 mL, graduated cylinder. With the magnetic stirrer on, mix 286 μL of glacial acetic acid with 450 mL of water, adjust the pH to 3.8 with a 50% w/v solution of sodium hydroxide in water and dilute to 500 mL with water (blank solution).
CHROMATOGRAPHIC CONDITIONS
(a) Use a column (30 cm × 7.8 mm) packed with appropriate porous silica beads (5 μm) with a fractionation range for proteins of approximately 5,000 to 150,000 (Tosoh Biosciences TSK G2000 SWXL is suitable). New columns should be conditioned prior to first use and previously conditioned columns saturated prior to the test with saturation solution. To prepare the saturation solution dilute Interferon Beta-1a Concentrated Solution that, following freeze-thaw cycles, contains a percentage of degradation products (dimers and aggregates) of at least 20%, to contain 0.03% w/v of interferon beta-1a using a buffer prepared as follows. Mix 1.43 mL of glacial acetic acid to 400 mL with water, adjust the pH to 3.8 with 50% w/v solution of sodium hydroxide in water and dilute to 500 mL with water.
(b) Use isocratic elution and the mobile phase described below.
(c) Use a flow rate of 0.5 mL per minute.
(d) Use an ambient column temperature.
(e) Use a detection wavelength of 215 nm.
(f) Inject the volumes prescribed above for each solution.
MOBILE PHASE
Mix 2.86 mL of glacial acetic acid and 2.92 g of sodium chloride with 900 mL of water, adjust the pH to 3.8 with 50% w/v solution of sodium hydroxide in water and dilute to 1 L with water.
SYSTEM SUITABILITY
Inject solution (2) two times. The test is not valid unless the relative standard deviation of the percentage content for the aggregate and dimer peaks is less than 5%.
LIMITS
For products containing 8.8 μg or less of interferon beta-1a
In the chromatogram obtained with solution (1) the sum of the areas of any peaks eluting before the principal peak is not greater than 2% by normalisation.
For products containing more than 8.8 μg of interferon beta-1a
In the chromatogram obtained with solution (1) the sum of the areas of any peaks eluting before the principal peak is not greater than 1% by normalisation.
B. Carry out the method for size-exclusion chromatography, Appendix III C, using the following solutions. Store the solutions at a temperature of 2° to 8°.
(1) A quantity of the injection.
(2) 0.05% w/v of bovine albumin and 0.02% w/v of cytochrome C in the mobile phase.
(3) Mobile phase (blank solution)
CHROMATOGRAPHIC CONDITIONS
(a) Use a column (30 cm × 7.8 mm) packed with appropriate porous silica beads (5 μm) with a fractionation range for proteins of approximately 5,000 to 150,000 (Tosoh Biosciences TSK G2000 SWXL is suitable) fitted with a guard column (4 cm × 6 mm) packed with the same material.
(b) Use isocratic elution and the mobile phase described below.
(c) Use a flow rate of 1 mL per minute.
(d) Use an ambient column temperature.
(e) Use a detection wavelength of 280 nm.
(f) Inject 40 μL of solution (2), 100 μL of solution (3) and a quantity of solution (1) containing 25 μg of interferon beta-1a.
MOBILE PHASE
To 800 mL of water add 2.77 g sodium dihydrogen orthophosphate monohydrate, 21.9 g disodium hydrogen orthophosphate heptahydrate and 12.0 g sodium chloride, then dilute with water to 1000 mL. Adjust to pH 7.2.
SYSTEM SUITABILITY
The test is not valid unless, in the chromatogram obtained with solution (2), the resolution between the peaks due to bovine albumin and cytochrome C is at least 4.0.
The test is not valid unless, in the chromatogram obtained with solution (3), no peaks are observed between the retention time of the peak due to bovine albumin and the retention time of the peak due to cytochrome C. Initial blank injections may contain peaks as the solution is used to condition the column.
LIMITS
In the chromatogram obtained with solution (1) the sum of the areas of any peaks eluting before the principal peak is not greater than 2% by normalisation.
ASSAY
For protein
Carry out the method for liquid chromatography, Appendix III D, using the following solutions. Prepare 3 independent dilutions for each solution.
(1) Inject a quantity of the injection containing 5 μg of interferon beta-1a.
(2) Dilute the contents of a vial of interferon beta-1a EPCRS to obtain a solution containing 0.01% w/v of interferon beta-1a and inject a quantity containing 5 μg of interferon beta-1a.
CHROMATOGRAPHIC CONDITIONS
(a) Use a stainless steel column (25 cm × 2.1 mm) and a stainless steel pre-column (2 cm × 2.1 mm) both packed with butylsilyl silica gel for chromatography (5 μm) with a pore size of 30 nm (Vydac 214TP52 and Vydac 214GD52 are suitable).
(b) Use gradient elution and the mobile phase described below.
(c) Use a flow rate of 0.2 mL per minute.
(d) Use an ambient column temperature.
(e) Use a detection wavelength of 214 nm.
(f) Inject the volumes prescribed above for each solution.
MOBILE PHASE
Mobile phase A 0.1% v/v of trifluoroacetic acid.
Mobile phase B Dilute 1 volume of trifluoroacetic acid and 300 volumes of water to 1000 volumes with acetonitrile R1.
| Time (Minutes) | Mobile phase A (% v/v) | Mobile phase B (% v/v) | Comment |
| 0-20
20-25 25-26 26-40 |
100→0
0 0→100 100 |
0→100
100 100→0 0 |
linear gradient
isocratic linear gradient re-equilibration |
SYSTEM SUITABILITY
Inject the three independent dilutions of solution (2). The Assay is not valid unless:
the relative standard deviation of the area of the principal peak is not more than 3.0%;
the symmetry factor of the peak due to interferon beta-1a is between 0.8 and 2.0.
DETERMINATION OF CONTENT
Calculate the content of C908H1406N246O252S7 in the injection from the chromatograms obtained and using the declared content of C908H1406N246O252S7 in interferon beta-1a EPCRS.
For potency
The potency of interferon beta-1a is estimated by comparing its ability to protect cells against a viral cytopathic effect with the same ability of the appropriate International Standard of human recombinant interferon beta-1a or of a reference preparation calibrated in International Units.
The International Unit is the activity contained in a stated amount of the appropriate International Standard. The equivalence in International Units of the International Standard is stated by the World Health Organisation.
Carry out the assay using a suitable method, based on the following design.
Use, in standard culture conditions, an established cell line sensitive to the cytopathic effect of a suitable virus and responsive to interferon. The cell cultures and viruses that have been shown to be suitable include the following:
— WISH cells (ATCC No. CCL-25) and vesicular stomatitis virus VSV, Indiana strain (ATCC No. VR-158) as infective agent;
— A549 cells (ATCC No. CCL-185) and encephalomyocarditis virus EMC (ATCC No. VR-129B) as infective agent.
Incubate in at least 4 series, cells with 3 or more different concentrations of the preparation to be examined and the reference preparation in a microtitre plate and include in each series appropriate controls of untreated cells. Choose the concentrations of the preparations such that the lowest concentration produces some protection and the largest concentration produces less than maximal protection against the viral cytopathic effect. Add at a suitable time the cytopathic virus to all wells with the exception of a sufficient number of wells in all series, which are left with uninfected control cells. Determine the cytopathic effect of the virus quantitatively with a suitable method. Calculate the potency of the preparation to be examined by a suitable method (for example, Supplementary Chapter IV G). The confidence limits (P = 0.95) are not less than 64 per cent and not more than 156 per cent of the estimated potency.
STORAGE
Interferon Beta-1a Injection should be protected from light and stored at a temperature of 2° to 8°. It should not be allowed to freeze.
LABELLING
The label of the sealed container states the micrograms per millilitre, and the number of MIU (Million International Units).