

(Ph. Eur. monograph 1639)
C908H14O6N246O252S7 Mr approx. 22 500
Action and use
Cytokine.
DEFINITION
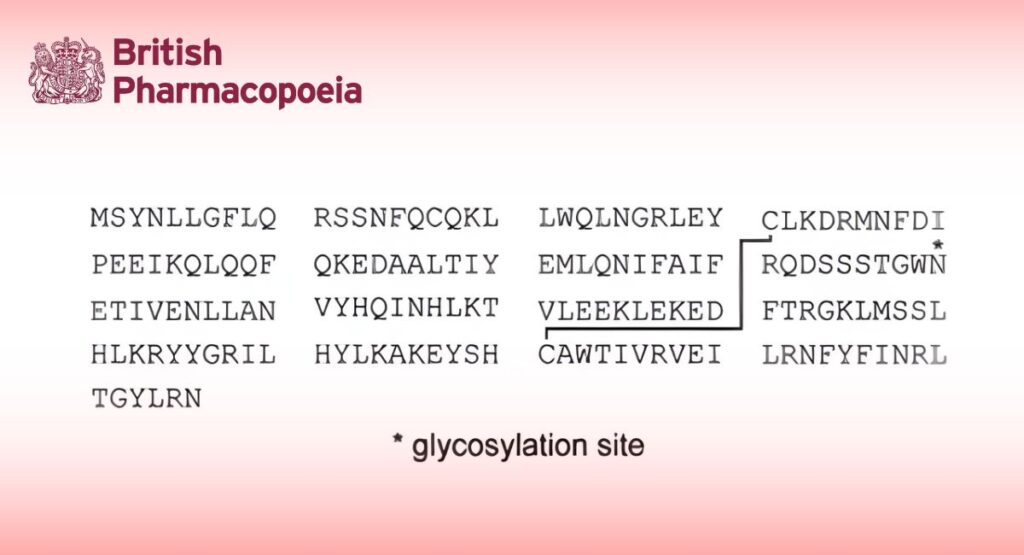
Solution of a glycosylated protein having the same amino acid sequence and disulfide bridge and a similar glycosylation pattern as interferon beta produced by human diploid fibroblasts in response to viral infections and various other inducers. It exerts antiviral, antiproliferative and immunomodulatory activity.
Content
Minimum 0.20 mg of protein per millilitre.
Potency
Minimum 1.5 × 10 IU per milligram of protein.
It may contain buffer salts.
PRODUCTION
Interferon beta-1a concentrated solution is produced by a method based on recombinant DNA (rDNA) technology, using mammalian cells in culture.
Prior to release, the following tests are carried out on each batch of interferon beta-1a concentrated solution, unless exemption has been granted by the competent authority.
Host-cell-derived proteins
The limit is approved by the competent authority.
Host-cell or vector-derived DNA
The limit is approved by the competent authority.
N-terminal truncated forms
Examination for specific N-terminal truncated forms should be performed using a suitable technique such as N-terminal sequence determination. The limits are approved by the competent authority.
Dimer and related substances of higher molecular mass
Not more than the amount approved by the competent authority, using an appropriate validated liquid chromatography method.
CHARACTERS
Appearance
Clear or slightly opalescent, colourless or slightly yellowish liquid.
IDENTIFICATION
A. It shows the expected biological activity (see Assay).
B. Isoform distribution. Mass spectrometry (2.2.43).
Introduction of the sample: Direct inflow of a desalted preparation to be examined or liquid chromatography-mass spectrometry combination.
Mode of ionisation: Electrospray.
Signal acquisition: Complete spectrum mode from 1100 to 2400.
Calibration: Use myoglobin in the m/z range of 600-2400; set the instrument within validated instrumental settings and analyse the sample; the deviation of the measured mass does not exceed 0.02 per cent of the reported mass.
Interpretation of results: A typical spectrum consists of 6 major glycoforms (A to F), which differ in their degree of sialylation and/or antennarity type as shown in Table 1639.-1.
Table 1639.-1.
| MS peak | Glycoform* | Expected Mr | Sialylation level |
| A | 2A2S1F | 22 375 | Disialylated |
| B | 2A1S1F | 22 084 | Monosialylated |
| C | 3A2S1F and/or 2A2S1F + 1 HexNacHex repeat | 22 739 | Disialylated |
| D | 3A3S1F | 23 031 | Trisialylated |
| E | 4A3S1F and/or 3A3S1F + 1 HexNacHex repeat | 23 400 | Trisialylated |
| F | 2A0S1F | 21 793 | Non-sialylated |
* 2A = biantennary complex type oligosaccharide; 3A = triantennary complex type oligosaccharide; 4A = tetraantennary complex type oligosaccharide; 0S = non-sialylated; 1S = monosialylated; 2S = disialylated; 3S = trisialylated; 1F = fucosylated.
Results: The mass spectrum obtained with the preparation to be examined corresponds, with respect to the 6 major peaks, to the mass spectrum obtained with interferon beta-1a CRS.
C. Peptide mapping (2.2.55) and liquid chromatography (2.2.29).
Test solution: Add 5 μL of a 242 g/L solution of tris(hydroxymethyl)aminomethane R and a volume of the preparation to be examined containing 20 μg of protein to a polypropylene tube of 0.5 mL capacity. Add 4 μL of a 1 mg/mL solution of endoprotease LysC R in 0.05 M tris-hydrochloride buffer solution pH 9.0 R. Mix gently and incubate at 30 °C for 2 h. Add 10 μL of a 15.4 g/L solution of dithiothreitol R. Dilute the solution with the same volume of a 573 g/L solution of guanidine hydrochloride R. Incubate at 4 °C for 3-4 h.
Reference solution: Prepare at the same time and in the same manner as for the test solution but using interferon beta-1a CRS instead of the preparation to be examined.
Precolumn:
— size: l = 0.02 m, Ø = 2.1 mm;
— stationary phase: spherical octadecylsilyl silica gel for chromatography R (5 μm) with a pore size of 30 nm.
Column:
— size: l = 0.25 m, Ø = 2.1 mm;
— stationary phase: spherical octadecylsilyl silica gel for chromatography R (5 μm) with a pore size of 30 nm.
Mobile phase:
— mobile phase A: dilute 1 mL of trifluoroacetic acid R to 1000 mL with water for chromatography R;
— mobile phase B: dilute 1 mL of trifluoroacetic acid R in 700 mL of acetonitrile R1, then dilute to 1000 mL with water for chromatography R;
| Time
(min) |
Mobile phase A
(per cent V/V) |
Mobile phase B
(per cent V/V) |
| 0 – 30 | 100 → 64 | 0 → 36 |
| 30 – 45 | 64 → 55 | 36 → 45 |
| 45 – 50 | 55 → 40 | 45 → 60 |
| 50 – 70 | 40 → 0 | 60 → 100 |
| 70 – 83 | 0 | 100 |
| 83 – 85 | 0 → 100 | 100 → 0 |
Flow rate: 0.2 mL/min.
Detection: Spectrophotometer at 214 nm.
Injection: Volume that contains 20 μg of digested protein.
System suitability: The chromatogram obtained with the reference solution is qualitatively similar to the chromatogram of interferon beta-1a digest supplied with interferon beta-1a CRS.
Results: The profile of the chromatogram obtained with the test solution corresponds to that of the chromatogram obtained with the reference solution.
TESTS
Impurities of molecular masses differing from that of interferon beta-1a
Polyacrylamide gel electrophoresis (2.2.31) under reducing conditions.
Resolving gel 12 per cent acrylamide.
Concentrated sample buffer concentrated SDS-PAGE sample buffer for reducing conditions R containing 2-mercaptoethanol as the reducing agent.
Sample buffer: Mixture of equal volumes of concentrated SDS-PAGE sample buffer for reducing conditions R and water R.
Test solution (a): Concentrate the preparation to be examined using a suitable method to obtain a protein concentration of 1.5 mg/mL.
Test solution (b): Mixture of equal volumes of test solution (a) and the concentrated sample buffer.
Test solution (c): Dilute test solution (a) to obtain a protein concentration of 0.6 mg/mL. Mix equal volumes of this solution and the concentrated sample buffer.
Test solution (d): Mix 8 μL of test solution (c) and 40 μL of the sample buffer.
Test solution (e): Mix 15 μL of test solution (d) and 35 μL of the sample buffer.
Test solution (f): Mix 18 μL of test solution (e) and 18 μL of the sample buffer.
Test solution (g): Mix 12 μL of test solution (f) and 12 μL of the sample buffer.
Reference solution: Solution of relative molecular mass markers suitable for calibrating SDS-PAGE gels in the range of 15-67 kDa. Dissolve in the sample buffer.
Sample treatment: Boil for 3 min.
Application: 20 μL of test solutions (b) to (g) and the reference solution.
Detection: Coomassie staining, carried out as follows: immerse the gel in Coomassie staining solution R1 at 33-37 °C for 90 min with gentle shaking, then remove the staining solution; destain the gel with a large excess of a mixture of 1 volume of glacial acetic acid R, 1 volume of 2-propanol R and 8 volumes of water R.
Apparent molecular masses Interferon beta-1a = about 23 000; underglycosylated interferon beta-1a = about 21 000; deglycosylated interferon beta-1a = about 20 000; interferon beta-1a dimer = about 46 000.
Identification of bands: Use the electropherogram provided with interferon beta-1a CRS.
System suitability:
— the validation criteria are met (2.2.31);
— a band is seen in the electropherogram obtained with test solution (g);
— a gradation of intensity of staining is seen in the electropherograms obtained with test solutions (b) to (g).
Limits:
— in the electropherogram obtained with test solution (c), the band corresponding to underglycosylated interferon beta-1a is not more intense than the principal band in the electropherogram obtained with test solution (e) (5 per cent);
— in the electropherogram obtained with test solution (b), the band corresponding to deglycosylated interferon beta-1a is not more intense than the principal band in the electropherogram obtained with test solution (e) (2 per cent); any other band corresponding to an impurity of a molecular mass lower than that of interferon beta-1a, apart from the band corresponding to underglycosylated interferon beta-1a is not more intense than the principal band in the electropherogram obtained with test solution (f) (1 per cent).
Oxidised interferon beta-1a
Maximum 6 per cent.
Use the chromatogram obtained with the test solution in identification C. Locate the peaks due to the peptide fragment comprising amino acids 34-45 and its oxidised form using the chromatogram of oxidised interferon beta-1a digest supplied with interferon beta-1a CRS.
Calculate the percentage of oxidation of interferon beta-1a using the following expression:
A34-45ox/ (A34-45 + A34-45ox)
A34-45ox = area of the peak due to the oxidised peptide fragment 34-45;
A34-45 = area of the peak due to the peptide fragment 34-45.
Bacterial endotoxins (2.6.14)
Less than 0.7 IU in the volume that contains 1 × 10 IU of interferon beta-1a, if intended for use in the manufacture of parenteral preparations without a further appropriate procedure for removal of bacterial endotoxins.
ASSAY
Protein
Liquid chromatography (2.2.29). Prepare 3 independent dilutions for each solution.
Test solution: Dilute the preparation to be examined to obtain a concentration of 100 μg/mL.
Reference solution: Dissolve the contents of a vial of interferon beta-1a CRS to obtain a concentration of 100 μg/mL.
Precolumn:
— size: l = 0.02 m, Ø = 2.1 mm;
— stationary phase: end-capped butylsilyl silica gel for chromatography R (5 μm) with a pore size of 30 nm.
Column:
— size: l = 0.25 m, Ø = 2.1 mm;
— stationary phase: end-capped butylsilyl silica gel for chromatography R (5 μm) with a pore size of 30 nm.
Mobile phase:
— mobile phase A: 0.1 per cent V/V solution of trifluoroacetic acid R;
— mobile phase B: to 300 mL of water for chromatography R, add 1 mL of trifluoroacetic acid R and dilute to 1000 mL with acetonitrile R1;
| Time
(min) |
Mobile phase A
(per cent V/V) |
Mobile phase B
(per cent V/V) |
| 0 – 20 | 100 → 0 | 0 → 100 |
| 20 – 25 | 0 | 100 |
| 25 – 26 | 0 → 100 | 100 → 0 |
| 26 – 40 | 100 | 0 |
Flow rate: 0.2 mL/min.
Detection: Spectrophotometer at 214 nm.
Injection: 50 μL.
Retention time: Interferon beta-1a = about 20 min.
System suitability: Reference solution:
— symmetry factor: 0.8 to 2.0 for the peak due to interferon beta-1a;
— repeatability: maximum relative standard deviation of 3.0 per cent between the peak areas obtained after injection of the 3 independent dilutions.
Calculate the content of interferon beta-1a (C908H1406N246O252S7) taking into account the assigned content of C908H1406N246O252S7 in interferon beta-1a CRS.
Potency
The potency of interferon beta-1a is estimated by comparing its ability to protect cells against a viral cytopathic effect with the same ability of the appropriate International Standard of human recombinant interferon beta-1a or of a reference preparation calibrated in International Units.
The International: Unit is the activity contained in a stated amount of the appropriate International Standard. The equivalence in International Units of the International Standard is stated by the World Health Organization.
Carry out the assay using a suitable method, based on the following design.
Use, in standard culture conditions, an established cell line sensitive to the cytopathic effect of a suitable virus and responsive to interferon. The cell cultures and viruses that have been shown to be suitable include thefollowing:
— WISH cells (ATCC No. CCL-25) and vesicular stomatitis virus VSV, Indiana strain (ATCC No. VR-158) as infective agent;
— A549 cells (ATCC No. CCL-185) and encephalomyocarditis virus EMC (ATCC No. VR-129B) as infective agent.
Incubate in at least 4 series, cells with 3 or more different concentrations of the preparation to be examined and the reference preparation in a microplate and include in each series appropriate controls of untreated cells.
Choose the concentrations of the preparations such that the lowest concentration produces some protection and the largest concentration produces less than maximal protection against the viral cytopathic effect. Add at a suitable time the cytopathic virus to all wells with the exception of a sufficient number of wells in all series, which are left with uninfected control cells. Determine the cytopathic effect of the virus quantitatively with a suitable method. Calculate the potency of the preparation to be examined by the usual statistical methods (for example, 5.3).
The estimated potency is not less than 80 per cent and not more than 125 per cent of the stated potency. The confidence limits (P = 0.95) are not less than 64 per cent and not more than 156 per cent of the estimated potency.
STORAGE
In an airtight container, protected from light, at a temperature below -70 °C. If the substance is sterile, store in a sterile, airtight, tamper-evident container.
LABELLING
The label states:
— the interferon beta-1a content, in milligrams per millilitre;
— the antiviral activity, in International Units per millilitre;
— where applicable, that the substance is suitable for use in the manufacture of parenteral preparations.