

(Ph. Eur. monograph 3103)
C6530H10068N1752O2026S44 (dimer without glycosylation) Mr approx. 147 kDa (dimer without glycosylation)
Action and use
Monoclonal antibody (TNF); treatment of arthritis.
DEFINITION
Solution of a monoclonal antibody consisting of a bisdisulfide dimer of 1342 amino acid residues with a molecular weight of approximately 150 kDa, which binds with high affinity to both soluble and transmembrane forms of TNF-α.
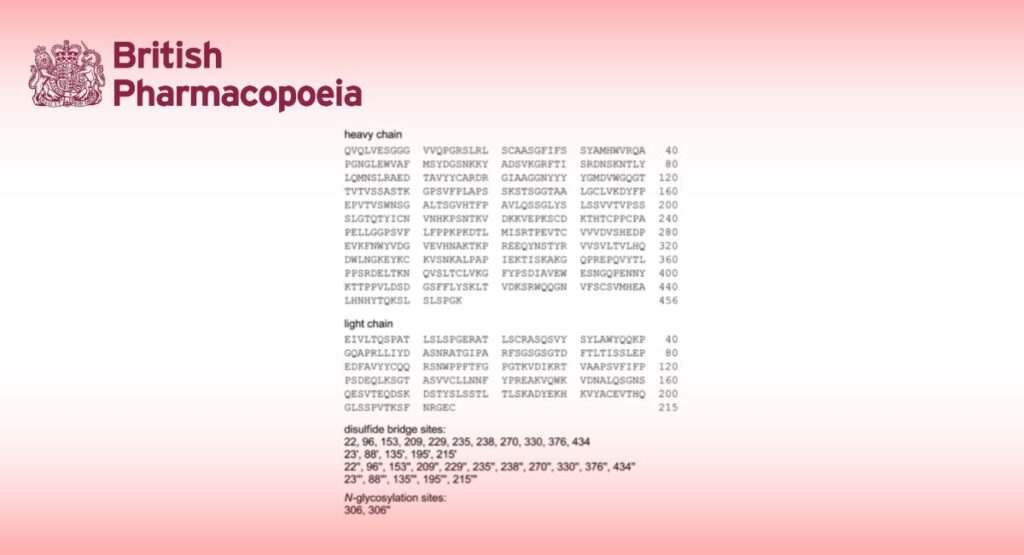
Golimumab is a human IgG1 kappa monoclonal antibody representing a glycosylated immunoglobulin with one N-linked glycosylation site (Asn 306) in the CH2 domain of each heavy chain. The detected oligosaccharides are mostly G0F (absence of terminal galactose), G1F (one terminal galactose), G2F (two terminal galactoses) and mono-sialylated structures. Each heavy chain consists of 456 amino acids with 11 cysteine residues, and each light chain consists of 215 amino acids with five cysteine residues. All cysteine residues in heavy and light chains are involved in either intra- or inter-disulfide bonding.
Content (milligrams of protein per millilitre) As approved by the competent authority.
PRODUCTION
Golimumab is produced in a suitable mammalian cell expression system by a method based on recombinant DNA (rDNA) technology. In the course of product development, it must be demonstrated that the manufacturing process consistently produces a product with the expected N-glycan occupancy and Fc integrity (e.g., binding to Fcγ and FcRn receptors) using suitably qualified assay(s).
Prior to release, the following tests are carried out on each batch of golimumab concentrated solution, unless an exemption has been granted by the competent authority.
Host-cell-derived proteins (2.6.34)
The limit is approved by the competent authority.
Host-cell- and vector-derived DNA (2.6.35)
The limit is approved by the competent authority.
Residual Protein A
The limit is approved by the competent authority.
Glycan analysis
Use a suitable procedure developed according to general chapter 2.2.59. Glycan analysis of glycoproteins, section 2-3:
— after desalting, release the glycans using one of the agents described in Table 2.2.59.-1, for example peptide N-glycosidase F (PNGase F);
— if needed, label the released glycans with one of the fluorescent labelling agents described in Table 2.2.59.-2;
— analyse the labelled or unlabelled glycans using a suitable technique.
The following procedure is given as an example.
Solution A: Mix 4.75 mL of a 1 per cent V/V solution of ammonia R and 0.25 mL of a 10 g/L solution of sodium dodecyl sulfate R. Add 50 μL of 2-mercaptoethanol R and vortex for 30 s.
Derivatisation solution: Dissolve 4.0 g of sodium acetate R and 2.0 g of boric acid R in 90 mL of methanol R2. Dilute to 100 mL with methanol R2. Add 90 mg of 2-aminobenzoic acid R and 120 mg of sodium cyanoborohydride R to 3.0 mL of this solution.
Test solution: Dilute the preparation to be examined with water R to obtain a concentration of about 10 mg/mL. Further dilute 10 μL of this solution with 30 μL of solution A. Heat at 100 °C for 2 min and cool to room temperature for at least 10 min. Add 2 μL of a 2.5 U/mL solution of peptide N-glycosidase F R. Incubate at 37 °C overnight. Cool to room temperature for at least 10 min and add 2 μL of glacial acetic acid R. Add 100 μL of derivatisation solution, mix and centrifuge. Incubate at 80 °C for 55-65 min and cool to room temperature. Add 1 mL of a 95 per cent V/V solution of acetonitrile R. Purify the mixture of labelled glycans using a suitable filter. Elute the labelled glycans with 1 mL of a 20 per cent V/V solution of acetonitrile R.
Reference solution (a): Dissolve the contents of a vial of golimumab CRS in water R to obtain a concentration of about 10 mg/mL. Carry out the glycan release at the same time and in the same manner as for the test solution.
Reference solution (b): Use a suitable golimumab in-house reference preparation shown to be representative of batches tested clinically and batches used to demonstrate consistency of production.
Dilute, if necessary, with water R to obtain a concentration of about 10 mg/mL. Carry out the glycan release at the same time and in the same manner as for the test solution.
Blank solution Use 10 μL of water R to carry out glycan release.
Analyse the labelled glycans by liquid chromatography (2.2.29).
Column:
— size: l = 0.15 m, Ø = 2.0 mm;
— stationary phase: amino alkyl vinyl polymer for chromatography R (5 μm);
— temperature: 50 °C.
Mobile phase:
— mobile phase A: to 1600 mL of water for chromatography R, add 50 mL of glacial acetic acid R and 10 mL of triethylamine R; dilute to 2000 mL with water for chromatography R;
— mobile phase B: to 1600 mL of acetonitrile R, add 10 mL of glacial acetic acid R; dilute to 2000 mL with
acetonitrile R;
| Time (min) |
Mobile phase A (per cent V/V) |
Mobile phase B (per cent V/V) |
| 0 – 2 | 30 | 70 |
| 2 – 82 | 30 → 95 | 70 → 5 |
| 82 – 97 | 95 | 5 |
Flow rate 0.3 mL/min.
Detection: Fluorimeter at 360 nm for excitation and 425 nm for emission.
Autosampler Set at 4 °C.
Injection 50 μL.
Identification of peaks: Use the chromatogram in Figure 3103.-1 to identify the 6 peaks corresponding to fucosylated (peaks 1, 2 and 3), other neutral (peak cluster 4), mono-sialylated (peak 5) and di-sialylated (peak 6) glycans; record the retention time of each peak.
System suitability:
— the chromatogram obtained with reference solution (a) is qualitatively similar to the chromatogram supplied with golimumab CRS and peaks 1 to 6 are clearly visible;
— no significant peaks are observed in the chromatogram obtained with the blank solution.
Results:
— the profile of the chromatogram obtained with the test solution corresponds to that of the chromatogram obtained with reference solution (b);
— the retention times of the peaks in the chromatogram obtained with the test solution correspond to those in the chromatogram obtained with reference solution (b);
— no additional peaks are observed in the chromatogram obtained with the test solution in comparison with the chromatogram obtained with reference solution (b).
Calculate the relative peak areas of the individual peaks corresponding to fucosylated, other neutral, mono- and di- sialylated glycans with reference to the sum of the areas of all retained glycan peaks.
Calculate the percentage contents of other neutral and sialylated glycans, using the following expressions:
A/A+B x 100
B/A+B x 100
A = sum of the areas of the peaks due to fucosylated and other neutral glycans;
B = sum of the areas of the peaks due to mono- and di-sialylated glycans.
NOTE: other neutral and mono-sialylated glycans elute as peak clusters and are integrated as such.
Limits:
— percentage of neutral glycans: as authorised by the competent authority;
— percentage of sialylated glycans: as authorised by the competent authority.
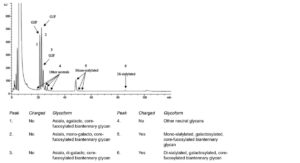
Figure 3103.-1. – Chromatogram for glycan analysis of golimumab
Charged variants
Capillary electrophoresis (2.2.47).
The following procedure is given as an example.
Solution B: Use pI marker 7.6 and pI marker 9.5, prepared according to the manufacturer’s instructions. Mix 1400 μL of a 1 per cent m/m solution of methyl cellulose, 20 μL of pI marker 7.6, 40 μL of pI marker 9.5, 40 μL of carrier ampholyte solution pH 3-10, 120 μL of carrier ampholyte solution pH 8-10.5 and 400 μL of a 1 per cent V/V solution of tetramethylethylenediamine R.
Test solution: Dilute the preparation to be examined with water R to obtain a concentration of 10 mg/mL. To 10 μL of this solution, add 1 μL of a 5 mg/mL solution of carboxypeptidase B R. Incubate at 25 °C for 30 min and cool on ice for at least 30 min. To 5 μL of the digested solution, add 94 μL of water R and 101 μL of solution B. Use this solution within 3 h of preparation.
Reference solution (a): Dissolve the contents of a vial of golimumab CRS in water R to obtain a concentration of 10 mg/mL. Proceed in the same manner as for the test solution.
Reference solution (b): Use a suitable golimumab in-house reference preparation shown to be representative of batches tested clinically and batches used to demonstrate consistency of production. Dilute with water R to obtain a concentration of 10 mg/mL. Proceed in the same manner as for the test solution.
Reference solution (c) Use pI marker 8.7 and pI marker 9.0, prepared according to the manufacturer’s instructions. Mix 2 μL of each pI marker, 95 μL of water R and 101 μL of solution B.
Blank digest: Prepare at the same time and in the same manner as for the test solution but using water R instead of the preparation to be examined.
Blank solution: Mix 99 μL of water R and 101 μL of solution B.
Focusing:
— catholyte: mix 5 mL of a 0.1 per cent m/m solution of methyl cellulose and 26 μL of a 500 g/L solution of sodium hydroxide R (100 mM solution of sodium hydroxide R in a 0.1 per cent m/m solution of methyl cellulose);
— anolyte: mix 5 mL of a 0.1 per cent m/m solution of methyl cellulose and 270 μL of an 85 per cent m/m solution of phosphoric acid R (80 mM solution of phosphoric acid R in a 0.1 per cent m/m solution of methyl cellulose).
Capillary:
— material: fluorocarbon-coated;
— size: total length = 5 cm, Ø = 100 μm;
— temperature: 25 °C.
Detection At 280 nm.
Autosampler Set at 4 °C.
Sample volume 160 μL.
Focusing Apply a field strength of 3000 V for 8 min.
Identification of peaks: Use the electropherogram in Figure 3103.-2 to identify the 4 major peaks C, 1, 2 and 3, and the 2 minor peaks A and B. Additional peaks may be present.
System suitability:
— in the electropherogram obtained with reference solution (a), the peaks corresponding to pI marker 7.6 and pI marker 9.5 are clearly visible;
— in the electropherogram obtained with reference solution (a), 6 peaks (4 major and 2 minor) in the pI region 8.5-9.0 are clearly visible;
— in the electropherogram obtained with reference solution (c), the peaks corresponding to pI marker 7.6, pI marker 8.7, pI marker 9.0 and pI marker 9.5 are clearly visible;
— resolution: minimum 5.0 between the peaks corresponding to pI marker 8.7 and pI marker 9.0;
— in the electropherogram obtained with the blank digest, the peaks corresponding to pI marker 7.6 and pI marker 9.5 are clearly visible; no additional peaks are observed between pI marker 7.6 and pI marker 9.5;
— in the electropherogram obtained with the blank solution, the peaks corresponding to pI marker 7.6 and pI marker 9.5 are clearly visible; no additional peaks are observed between pI marker 7.6 and pI marker 9.5.
Results:
— the electropherogram obtained with the test solution is similar to the electropherogram obtained with reference solution (b). Plot the migration distances of the relevant pI markers versus their pI and determine the apparent isoelectric points of the principal components of the test solution and reference solution (b); they do not differ by more than 0.05 pI units;
— no additional peaks are observed in the electropherogram obtained with the test solution in comparison to the electropherogram obtained with reference solution (b).
Calculate the relative peak areas of the individual peaks due to isoforms with reference to the total area of all peaks.
Limits:
— sum of isoforms C, 1, 2 and 3: as authorised by the competent authority;
— isoform 3: as authorised by the competent authority;
— isoform 2: as authorised by the competent authority;
— isoform 1: as authorised by the competent authority;
— isoform C: as authorised by the competent authority;
— isoform B: as authorised by the competent authority.
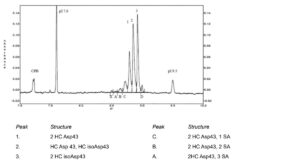
Figure 3103.-2. – Electropherogram for the test for charged variants of golimumab
CHARACTERS
Appearance
Colourless or light yellow liquid.
IDENTIFICATION
A. It complies with the limits of the assay (potency).
B. Peptide mapping (2.2.55).
SELECTIVE CLEAVAGE OF THE PEPTIDE BONDS
Dilution buffer: Dilute 500 μL of 1 M tris-hydrochloride buffer solution pH 8.0 R to 10 mL with water R.
Test solution: Dilute the preparation to be examined with the dilution buffer to obtain a concentration of about 10 mg/mL.
Desalt 100 μL by a suitable procedure. Transfer a volume of the desalted solution containing 200 μg of protein to a polypropylene tube and evaporate to dryness.
Reference solution: Dissolve the contents of a vial of golimumab CRS in the dilution buffer to obtain a concentration of about 10 mg/mL. Desalt a volume of this preparation at the same time and in the same manner as for the test solution.
Reduction and alkylation To 5 mL of water R, add 11.5 g of guanidine hydrochloride R. Dilute to 15 mL with water R. To 1500 μL of this solution, add 100 μL of 1 M tris-hydrochloride buffer solution pH 8.0 R, 20 μL of a 186 g/L solution of sodium edetate R, 20 μL of a 154 g/L solution of dithiothreitol R and 360 μL of water R. Dilute to 2.0 mL with water R. Add 150 μL to the desalted protein and incubate at 37 °C for 60 min. Add 3.0 μL of a freshly prepared 184 g/L solution of iodoacetamide R and incubate at room temperature for 60 min protected from light. Add 1 μL of a 154 g/L of solution of dithiothreitol R.
Digestion Add 350 μL of dilution buffer and 400 μL of a 0.01 mg/mL solution of lysyl endopeptidase R in dilution buffer. Incubate a 37 °C for 60 min. Add another 4 μL of a 1 mg/mL solution of lysyl endopeptidase R, mix gently and spin down. Incubate at 37 °C for 3 hours. Add 5 μL of trifluoroacetic acid R and mix gently.
NOTE: a protease/protein ratio of 1:25 (m/m) is used.
Carry out the reduction/alkylation and digestion steps for the reference solution in the same manner as for the test solution.
CHROMATOGRAPHIC SEPARATION [Store the solutions at 2-8 °C]
Liquid chromatography (2.2.29). Store the solutions at 2-8 °C.
Column:
— size: l = 0.15 m, Ø = 2.1 mm;
— stationary phase: end-capped octadecylsilyl silica gel for chromatography R (5 μm) with a pore size of 30 nm;
— temperature: 40 °C.
Mobile phase:
— mobile phase A: to 1000 mL of water for chromatography R, add 1 mL of trifluoroacetic acid R and mix;
— mobile phase B: to 1000 mL of acetonitrile R1, add 1 mL of trifluoroacetic acid R and mix;
| Time (min) |
Mobile phase A (per cent V/V) |
Mobile phase B (per cent V/V) |
| 0 – 5 | 100 | 0 |
| 5 – 10 | 100 → 98 | 0 → 2 |
| 10 – 15 | 98 → 95 | 2 → 5 |
| 15 – 60 | 95 → 80 | 5 → 20 |
| 60 – 95 | 80 → 78 | 20 → 22 |
| 95 – 130 | 78 → 67 | 22 → 33 |
| 130 – 150 | 67 → 65 | 33 → 35 |
| 150 – 155 | 65 → 30 | 35 → 70 |
| 155 – 160 | 30 → 0 | 70 → 100 |
| 160 – 165 | 0 | 100 |
Flow rate 0.2 mL/min.
Detection Spectrophotometer at 214 nm.
Autosampler Set at 4 °C.
Injection 100 μL.
Identification of peaks: Use the chromatogram supplied with golimumab CRS to identify peaks 1 to 40.
System suitability Reference solution:
— the chromatogram obtained is qualitatively similar to the chromatogram supplied with golimumab CRS and peaks 1 to 40 are clearly visible;
— peaks 26 and 27 are separated as shown in the chromatogram supplied with golimumab CRS.
Results:
— the profile of the chromatogram obtained with the test solution corresponds to that of the chromatogram obtained with the reference solution except for peaks 12, 13, 29 and 30 that show known variability from batch to batch;
— no additional peak in the chromatogram obtained with the test solution has a peak area ratio of more than 0.08 with reference to peak 20.
TESTS
pH (2.2.3)
As approved by the competent authority.
Deamidation analysis
Proceed as described for peptide mapping, with the following modifications.
NOTE: because of the instability of the solutions, analysis is limited to 3 samples within a run.
Column:
— size: l = 0.25 m, Ø = 2.1 mm;
— stationary phase: end-capped octadecylsilyl silica gel for chromatography R (3.5 μm) with a pore size of 30 nm;
— temperature: 50 °C.
Mobile phase:
— mobile phase C: mix 700 mL of mobile phase A and 300 mL of mobile phase B;
— mobile phase D: mix 300 mL of mobile phase A and 700 mL of mobile phase B;
| Time (min) |
Mobile phase C (per cent V/V) |
Mobile phase D (per cent V/V) |
| 0 – 15 | 100 | 0 |
| 15 – 75 | 100 → 87.5 | 0 → 12.5 |
| 75 – 80 | 87.5 → 0 | 12.5 → 100 |
| 80 – 85 | 0 | 100 |
Identification of peaks: Use the chromatogram supplied with golimumab CRS to identify peaks 1-8 corresponding to native and deamidated isoforms at LC Asn93 and HC Asn43.
System suitability Reference solution:
— the chromatogram obtained is qualitatively similar to the chromatogram supplied with golimumab CRS and peaks 1 to 7 are clearly visible;
— resolution: minimum 1.1 between peaks 6 and 7.
Result In the chromatogram obtained with the test solution, peaks 1 to 7 are clearly visible; the retention times of peaks 1-7 in the chromatogram obtained with the test solution correspond to those of peaks 1-7 in the chromatogram obtained with the reference solution.
Calculate the relative peak areas of the individual peaks corresponding to native and deamidated isoforms with reference to the sum of the areas of peaks 1-8.
Calculate the percentage contents of total deamidated LC Asn93 and total deamidated HC Asn43, using the following expressions:
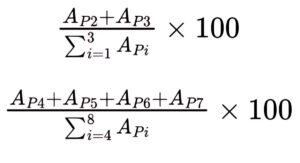
APi = area of peaks 1-8.
NOTE: peak 8 elutes as a cluster and is integrated as such.
Limits:
— total deamidated LC Asn93: maximum 5.8 per cent;
— total deamidated HC Asn43: maximum 79 per cent;
— sum of peaks 4 and 5: maximum 30 per cent.
Related proteins
Capillary electrophoresis (2.2.47) under both reducing and non-reducing conditions.
Sample buffer (reducing conditions): Dissolve 1 g of sodium dodecyl sulfate R in tris(hydroxymethyl)aminomethane buffer solution pH 9.0 R1 and dilute to 100.0 mL with the same solution.
Sample buffer (non-reducing conditions): To 80 mL of water R, add 523 mg of bis-tris methane R. Add 10 mL of a 100 g/L solution of sodium dodecyl sulfate R. Adjust to pH 7.0 with a 210 g/L solution of citric acid monohydrate R and dilute to 100 mL with water R.
Test solution: Dilute the preparation to be examined with water R to obtain a concentration of 10 mg/mL:
— reducing conditions: mix 25 μL of the solution and 68 μL of sample buffer (reducing conditions). Add 2 μL of a 5 mg/mL solution of 10 kDa internal standard and 5 μL of 2-mercaptoethanol R. Incubate at 80 °C for 2 min;
— non-reducing conditions: mix 30 μL of the solution and 155 μL of sample buffer (non-reducing conditions). Add 5 μL of a 5 mg/mL solution of 10 kDa internal standard and 10 μL of a 16 g/L solution of N-ethylmaleimide R. Incubate at 75 °C for 5 min.
Reference solution (a) Dissolve the contents of a vial of golimumab CRS in water R to obtain a concentration of 10 mg/mL:
— reducing conditions: mix 2.5 μL of the solution and 75.5 μL of sample buffer (reducing conditions). Add 2 μL of a 5 mg/mL solution of 10 kDa internal standard, 5 μL of a 5 mg/mL solution of carbonic anhydrase, 5 μL of a 5 mg/mL solution of bovine albumin R and 5 μL of a 5 mg/mL solution of β-galactosidase. Add 3 μL of a 46 g/L solution of iodoacetamide R. Incubate at 80 °C for 2 min;
— non-reducing conditions: mix 5 μL of the solution and 150 μL of sample buffer (non-reducing conditions). Add 5 μL of a 5 mg/mL solution of 10 kDa internal standard, 10 μL of a 5 mg/mL solution of carbonic anhydrase, 10 μL of a 5 mg/mL solution of bovine albumin R and 10 μL of a 5 mg/mL solution of β-galactosidase. Add 10 μL of a 16 g/L solution of N-ethylmaleimide R. Incubate at 75 °C for 5 min.
Reference solution (b): Dissolve the contents of a vial of golimumab CRS in water R to obtain a concentration of 10 mg/mL:
— reducing conditions: mix 75 μL of the solution and 204 μL of sample buffer (reducing conditions). Add 6 μL of a 5 mg/mL solution of 10 kDa internal standard and 15 μL of 2-mercaptoethanol R. Incubate at 80 °C for 2 min;
— non-reducing conditions: mix 90 μL of the solution and 465 μL of sample buffer (non-reducing conditions). Add 15 μL of a 5 mg/mL solution of 10 kDa internal standard and 10 μL of a 16 g/L solution of N-ethylmaleimide R. Incubate at 75 °C for 5 min.
Capillary:
— material: uncoated fused silica;
— size: total length = about 30.2 cm, effective length = 20 cm, Ø = 50 μm.
Temperature 25 °C.
Gel buffer Use a formulation suitable for a sieving range of approximately 10-225 kDa.
Acidic wash solution dilute hydrochloric acid R1.
Basic wash solution 4 g/L solution of sodium hydroxide R.
Detection Spectrophotometer at 220 nm.
Autosampler Set at 25 °C.
Injection Electrokinetically at 5 kV reversed polarity for 20 s.
Migration: Apply a voltage of 15 kV reversed polarity for 35 min using the gel buffer as the electrolyte in both buffer reservoirs.
Migration time:
— reducing conditions: light chain = about 15 min; heavy chain = about 19 min;
— non-reducing conditions: intact IgG = about 27 min.
Calculate corrected areas of all peaks with a migration time greater than 11 min, using the following expression:
Ld×A/t
Ld = capillary length to detector;
A = uncorrected peak area;
t = migration time.
System suitability:
— in the electropherogram obtained with reference solution (a), all 5 peaks corresponding to the molecular weight markers and golimumab are clearly visible; plot the migration times of the markers versus their logarithmic molecular weight; the coefficient of determination (R ) calculated for the regression line is not less than 0.98;
— reducing conditions: the electropherogram obtained with reference solution (b) is qualitatively similar to the electropherogram supplied with golimumab CRS;
— non-reducing conditions: the electropherogram obtained with reference solution (b) is qualitatively similar to the electropherogram supplied with golimumab CRS.
Determine the molecular weight of the principal components of the test solution.
Result:
— the profile of the electropherogram obtained with the test solution is qualitatively similar to that of the
electropherogram obtained with reference solution (b), except for minor peaks, that may be absent in the
electropherogram obtained with the test solution. Calculate individual peak areas expressed as a percentage of the sum of all corrected peak areas.
Limits:
Reducing conditions:
— sum of all peaks other than the peaks due to heavy and light chains: maximum 1.7 per cent;
Non-reducing conditions:
— sum of all peaks other than the principal peak: maximum 1.7 per cent.
Impurities with molecular masses differing from that of golimumab
Size-exclusion chromatography (2.2.30): use the normalisation procedure.
Test solution: Dilute the preparation to be examined with the mobile phase to obtain a concentration of 10 mg/mL.
Reference solution (a): Dissolve the contents of a vial of golimumab CRS in the mobile phase to obtain a concentration of 10 mg/mL.
Reference solution (b): Dilute 50 μL of reference solution (a) with the mobile phase to obtain a concentration of 0.5 mg/mL.
Reference solution (c): Reconstitute a mixture of thyroglobulin, gamma-globulin, ovalbumin, myoglobin and vitamin B12 with 1 mL of water for chromatography R. Further dilute to 10 mL with water for chromatography R.
Precolumn:
— size: l = 0.04 m, Ø = 6 mm;
— stationary phase: hydrophilic silica gel for chromatography R (7 μm).
Column:
— size: l = 0.30 m, Ø = 7.8 mm;
— stationary phase: hydrophilic silica gel for chromatography R (5 μm) with a pore size of 25 nm and of a grade suitable for fractionation of globular proteins in the relative molecular mass range of 10 000 to 500 000 Da.
Mobile phase: Dissolve 11.5 g of sodium dihydrogen phosphate monohydrate R and 31.2 g of disodium hydrogen phosphate heptahydrate R in 800 mL of water for chromatography R. Dilute to 1000.0 mL with water for chromatography R; filter and degas.
Flow rate 1.0 mL/min.
Detection: Spectrophotometer at 214 nm and at 280 nm.
Autosampler Set at 4 °C.
Injection 20 μL.
Relative retention: With reference to golimumab monomer (retention time = about 9 min): aggregates = about 0.84.
NOTE: protein species that elute before the monomer peak are classified as aggregates, while those that elute after the monomer peak are classified as fragments.
System suitability:
— the chromatogram obtained with reference solution (a) is qualitatively similar to the chromatogram supplied with golimumab CRS;
— ratio (R) of the sum of the areas of the peaks at 214 nm over the sum of the areas of the peaks at 280 nm in the chromatograms obtained with reference solution (b): minimum 10;
— ratio of the area of the monomer peak at 214 nm over the area of the monomer peak at 280 nm in the
chromatograms obtained with reference solution (b): minimum 10;
— resolution at 214 nm: minimum 1.2 between the peaks due to gamma-globulin and ovalbumin in the chromatogram obtained with reference solution (c);
— number of theoretical plates: minimum 3750, calculated for the peak due to vitamin B12 in the chromatogram obtained with reference solution (c) at 214 nm.
Results:
— the retention time of the principal peak in the chromatogram obtained with the test solution corresponds to that of the principal peak in the chromatogram obtained with reference solution (a).
Calculate the relative area (in per cent) for the sum of peaks due to aggregates and for the sum of peaks due to fragments at 280 nm using the chromatograms obtained at 214 nm and R. Calculate the relative peak area (in per cent) for the sum of all peaks other than the monomer peak in the chromatogram obtained at 280 nm.
Limits:
— sum of all peaks other than the monomer peak: maximum 0.40 per cent;
— aggregates: maximum 0.22 per cent;
— fragments: maximum 0.15 per cent.
ASSAY
Protein (2.5.33, Method 1)
Test solution Dilute the preparation to be examined with a 9 g/L solution of sodium chloride R to obtain a concentration of about 0.5 mg/mL. Prepare and analyse each preparation in triplicate.
Record the UV spectrum at 280 nm Measure the value at the absorbance maximum of 280 nm.
Calculate the protein content, taking the specific absorbance to be 14.0.
Potency
The potency of golimumab is determined by comparison of dilutions of the test preparation with dilutions of
golimumab BRP using a suitable cell-based assay based on the inhibitory action of golimumab on the biological activity of TNF-α with a suitable readout for assessing this inhibitory effect.
The following procedure is given as an example.
Carry out a cell proliferation assay based on the ability of golimumab to block TNF-induced inhibition of murine fibrosarcoma WEHI-13VAR cell proliferation. The WEHI-13VAR cells (ATCC CRL-2148) are incubated with varying dilutions of test and reference preparations of golimumab in the presence of TNF-α. Cell growth is assessed by a staining method using a tetrazolium salt (MTS), which is converted by cellular dehydrogenases to a coloured formazan product. The amount of released formazan is then measured spectrophotometrically and is directly proportional to the number of living cells.
Assay medium: To 450 mL of RPMI 1640, add 50 mL of heat-inactivated foetal bovine serum, 5.0 mL of 29.24 g/L solution of L-glutamine R (0.2 M), 5.0 mL of 11 g/L solution of sodium pyruvate R (100 mM) and 5.0 mL of non-essential amino acids solution (100 ×).
Modified D-PBS: Dulbecco’s phosphate buffered saline (D-PBS), without calcium, or magnesium.
Test solution: Dilute the preparation to be examined with water R to obtain a concentration of about 10 mg/mL. Further dilute with assay medium to obtain a concentration of about 500 ng/mL. Prepare in triplicate.
Reference solution: Dissolve the contents of a vial of golimumab BRP in assay medium to obtain a concentration of about 500 ng/mL. Prepare in triplicate.
TNF-α working solutions Dissolve the contents of a vial of TNF-α according to the manufacturer’s instructions to obtain a concentration of 500 ng/mL (working solution A). Dilute 50 μL of this solution with 450 μL assay medium to obtain a concentration of 50 ng/mL (working solution B). Dilute 336 μL of this solution with 10 mL of assay medium to obtain a concentration of 1.68 ng/mL (‘TNF-α for neutralisation’). As the biological activity of TNF-α is likely to vary between different suppliers and also between different batches from the same supplier, this should be controlled by use of an appropriate standard (e.g. WHO International Standard for TNF-α).
Tetrazolium salt solution Dissolve 500 mg of tetrazolium salt R in modified D-PBS. Adjust to pH 7.0-7.5 with a 150 g/L solution of sodium hydroxide R. Further dilute to 250 mL with modified D-PBS to obtain a concentration of 2 mg/mL. To 8 mL of this solution, add 400 μL of a 0.96 mg/mL solution of phenazine methosulfate R and mix thoroughly.
Method.
Plate preparation Each replicate dilution of the test and reference solutions is placed in duplicate on the plate. Add 75 μL of assay medium to the wells designated for ‘TNF-α cytotoxicity curve’ (columns 1-12, row A) on a 96-well microplate. Add 90 μL of TNF-α working solution B to well A1. Transfer 15 μL from A1 through to A12. Discard 15 μL of solution from A12. Add 75 μL of assay medium to the wells designated for ‘cells only’ control (columns 1-6, row H). Add 50 μL of assay medium and 25 μL of TNF-α for neutralisation to the wells designated for ‘cells + TNF-α’ control (columns 7-12, row H). Add 50 μL of assay medium to the sample wells (columns 2-12, rows B-G) and 100 μL of the test or reference solutions (column 1, rows B-G). Further prepare a series of 2-fold dilutions (columns 2-12, rows B-G), by removing 50 μL from column 1 and transferring to the adjacent well in column 2, repeating for subsequent wells. Then, add 25 μL of TNF-α for neutralisation (columns 1-12, rows B-G). Incubate at 36-38 °C for 1 h in an incubator using 4-7 per cent CO2.
Cell preparation Prepare a suspension of WEHI-13VAR cells containing 2 × 10 cells per millilitre, using assay medium containing 8 μg/mL of actinomycin D.
Plating cells Add 25 μL of the cell suspension to each well maintaining the cells in a uniform suspension during addition.
Incubate at 36-38 °C for 20-24 h in an incubator using 4-7 per cent CO2.
Addition of tetrazolium salt Add 20 μL of tetrazolium salt solution to each well and re-incubate at 36-38 °C for 105-135 min using 4-7 per cent CO2. Add 25 μL of a 100 g/L solution of sodium dodecyl sulfate R. Estimate the quantity of formazan produced using a microtitre well plate reader at 490 ± 5 nm, 10-30 min after addition of SDS.
Calculate the potency of the preparation to be examined using the four-parameter logistic curve model (see general chapter 5.3).
System suitability:
— the TNF-α cytotoxicity curve corresponds to a sigmoid curve;
— the coefficient of determination calculated for the TNF-α control cytotoxicity curve (R ) is not less than 0.97;
— the standard curve is a sigmoid curve with well-defined upper and lower asymptotes and linear part;
— the values of the upper and lower asymptotes of the standard curve are within the pre-defined range established from the minimum and maximum values of the corresponding controls;
— the coefficient of determination calculated for the standard curve (R ) is not less than 0.97;
— maximum (‘cells only’ control) value to minimum (‘cells + TNF-α’ control) value ratio: minimum 3.0.
Result: The estimated potency is not less than 80 per cent and not more than 130 per cent relative to the reference solution.
In addition, the WEHI-164 cytotoxicity assay (2.7.26, Procedure B) has been found suitable. Carry out the assay as described with the following modifications.
Reference solution: Dissolve the contents of a vial of golimumab BRP in sterilised water for injections R to obtain a concentration of about 640 ng/mL. Analyse 2 independent dilutions per plate.
STORAGE
In an airtight container, under approved conditions.
LABELLING
The label states the content in milligrams of protein per millilitre.