


(Ph. Eur. monograph 1910)
DEFINITION
Purified fatty oil obtained from fresh farmed Salmo salar. The positional distribution (β(2)-acyl) is 60-70 per
cent for cervonic (docosahexaenoic) acid (C22:6 n-3; DHA), 25-35 per cent for timnodonic
(eicosapentaenoic) acid (C20:5 n-3; EPA) and 40-55 per cent for moroctic acid (C18:4 n-3).
Content
— sum of the contents of EPA and DHA (expressed as triglycerides): 10.0 per cent to 28.0 per cent.
A suitable antioxidant may be added.
PRODUCTION
The fish shall only be given feed with a composition that is in accordance with the relevant European Union
or other applicable regulations.
The content of dioxins and dioxin-like PCBs (polychlorinated biphenyls) is controlled using methods and
limits in accordance with the requirements set in the European Union or other applicable regulations.
The oil is produced by mechanical expression of fresh raw materials, either from the whole fish, or fish
where the fillets have been removed, at a temperature not exceeding 100 °C, and without using solvents.
After centrifugation, solid substances may be removed from the oil by cooling and filtering (winterisation).
CHARACTERS
Appearance
Pale pink liquid.
Solubility
Farmed Salmon Oil
Practically insoluble in water, very soluble in acetone and in heptane, slightly soluble in anhydrous ethanol.
IDENTIFICATION
Examine the C NMR spectra obtained in the assay for positional distribution (β(2)-acyl) of fatty acids. The
spectra contain peaks between 172 ppm and 173 ppm with shifts similar to those in the type spectrum
(Figure 1910.-2). The oil to be examined complies with the limits of this assay.
TESTS
Absorbance (2.2.25)
Minimum 0.10, measured at the absorption maximum between 470 nm and 480 nm.
Dissolve 5.0 mL in 5.0 mL of trimethylpentane R.
Acid value (2.5.1)
Maximum 2.0.
Anisidine value (2.5.36)
Maximum 10.0.
Peroxide value (2.5.5, Method A)
Maximum 5.0.
Unsaponifiable matter (2.5.7)
Maximum 1.5 per cent, determined on 5.0 g.
Linoleic acid (2.4.29)
Maximum 11.0 per cent.
Identify the peak due to linoleic acid using the chromatogram in Figure 1910.-1. Determine the percentage content by normalisation.
ASSAY
Positional distribution (β(2)-acyl) of fatty acids
Nuclear magnetic resonance spectrometry (2.2.33).
Apparatus High resolution FT-NMR spectrometer operating at minimum 300 MHz.
Test solution Dissolve 190-210 mg of fresh salmon oil in 500 μL of deuterated chloroform R. Prepare at
least 3 samples and examine within 3 days.
Acquisition of C NMR spectra The following parameters may be used:
— sweep width: 200 ppm (-5 to 195 ppm);
— irradiation frequency offset: 95 ppm;
— time domain: 64 K;
— pulse delay: 2 s;
— pulse program: zgig 30 (inverse gated, 30° excitation pulse);
— dummy scans: 4;
— number of scans: 4096.
Processing and plotting The following parameters may be used:
— size: 64 K (zero-filling);
— window multiplication: exponential;
— Lorentzian broadening factor: 0.2 Hz.
Use the CDCl3 signal for shift referencing. The shift of the central peak of the 1:1:1 triplet is set to 77.16 ppm.
Plot the spectral region δ 171.5-173.5 ppm. Compare the spectrum with the reference spectrum in Figure 1910.-2. The shift values lie within the ranges given in Table 1910.-1.
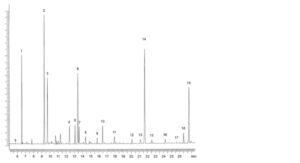
1. C14:0 5. C18:0 9. C18:3 n-3 13. C20:4 n-3 17. C22:5 n-6
2. C16:0 6. C18:1 n-9 10. C18:4 n-3 14. EPA 18. C22:5 n-3
3. C16:1 n-7 7. C18:1 n-7 11. C20:1 n-9 15. C22:1 n-11 19. DHA
4. C16:4 n-1 8. C18:2 n-6 12. C20:4 n-6 16. C21:5 n-3
Figure 1910.-1. – Chromatogram for the composition of fatty acids in farmed salmon oil
Table 1910.-1. – Shift values
| Signal | Shift range (ppm) |
| β DHA | 172.05 – 172.09 |
| α DHA | 172.43 – 172.47 |
| β EPA | 172.52 – 172.56 |
| α EPA | 172.90 – 172.94 |
| β C18:4 | 172.56 – 172.60 |
| α C18:4 | 172.95 – 172.99 |
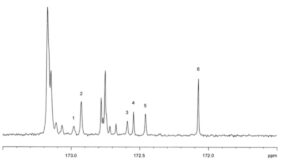
1. α C18:4 2. α EPA 3. β C18:4 4. β EPA 5. α DHA 6. β DHA
Figure 1910.-2. – C NMR spectrum: carbonyl region of farmed salmon oil
System suitability:
— signal-to-noise ratio: minimum 5 for the smallest relevant peak corresponding to α C18:4 signal (in
the range δ 172.95-172.99 ppm);
— peak width at half-height maximum 0.02 ppm for the central CDCl3 signal (at δ 77.16 ppm).
Calculation of positional distribution (β(2)-acyl) Use the following expression:
β/α+β × 100
α = peak area of the corresponding α-carbonyl peak;
β = peak area of β-carbonyl peak from C22:6 n-3, C20:5 n-3 or C18:4 n-3, respectively.
Limits:
— cervonic (docosahexaenoic) acid (C22:6 n-3; DHA): 60 per cent to 70 per cent;
— timnodonic (eicosapentaenoic) acid (C20:5 n-3; EPA): 25 per cent to 35 per cent;
— moroctic acid (C18:4 n-3): 40 per cent to 55 per cent.
EPA and DHA (2.4.29)
See Figure 1910.-1.
STORAGE
In an airtight, well-filled container, protected from light, under inert gas.
LABELLING
The label states:
— the concentration of EPA and DHA, expressed as triglycerides.